Governors beware: When newspapers play up unemployment milestones, it could cost you your seat.
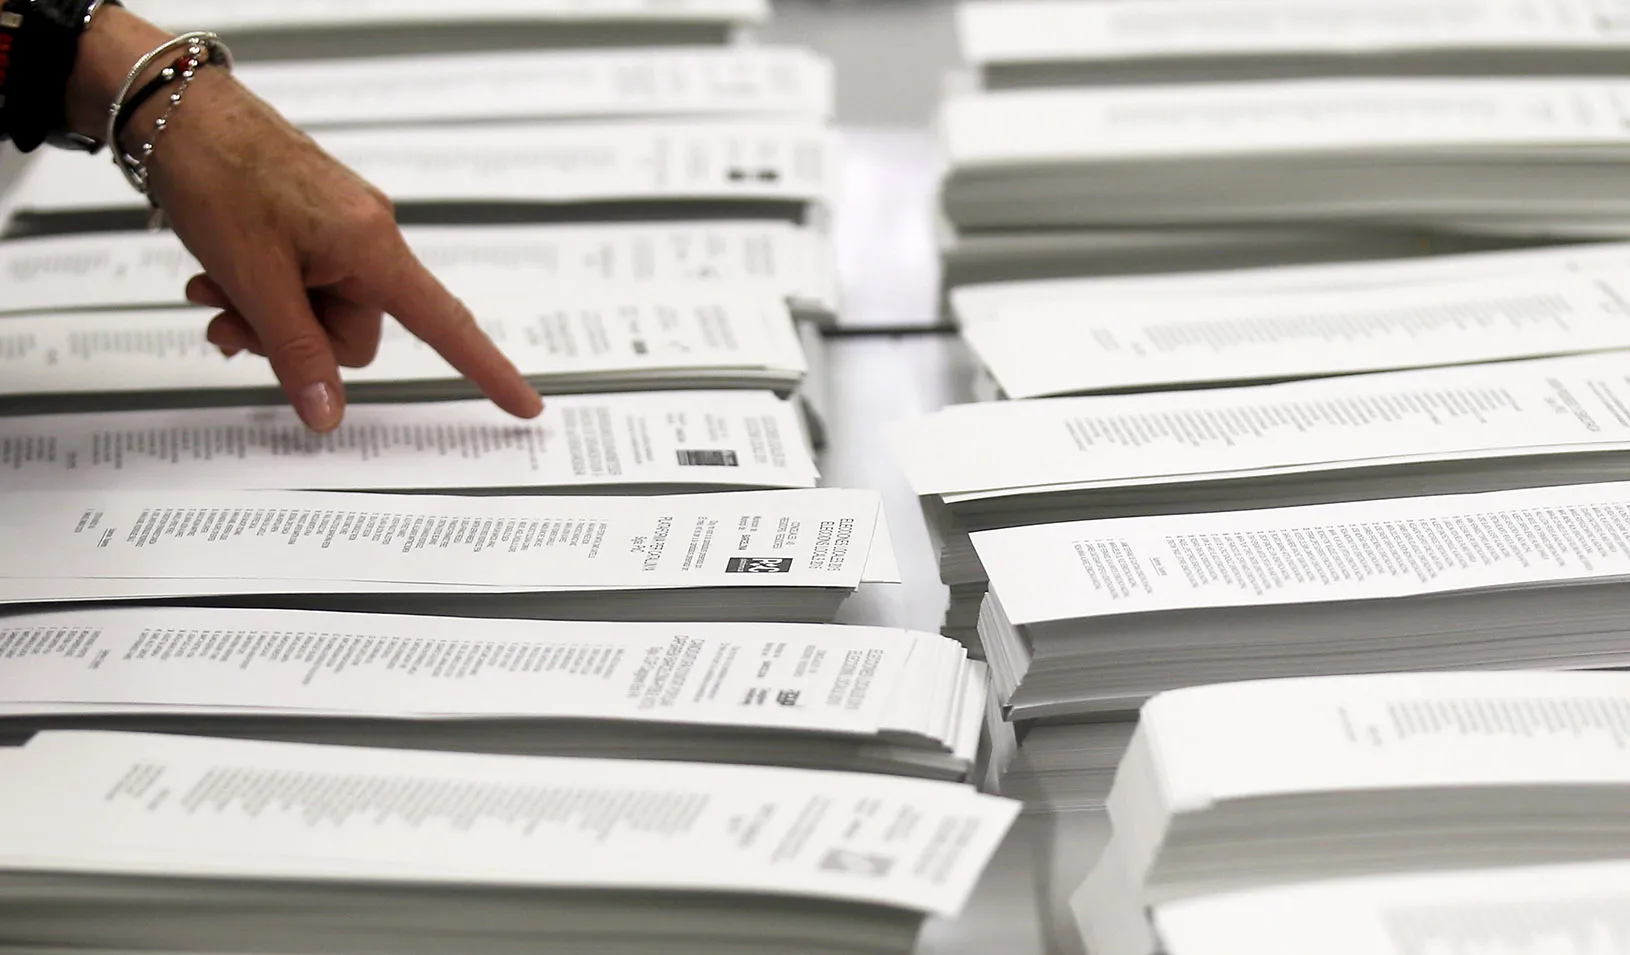
New research shows the impact of jobs reports on state elections. | Credit: Albert Gea
Journalists like to say that the news media doesn’t tell people what to think, but it does tell people what to think about. But how do the media’s choices about what to cover influence the way people vote — and, consequently, election results? And how can that be measured?
Intrigued by these questions, Gregory J. Martin, an assistant professor of political economy at Stanford Graduate School of Business, teamed up with Marcel Garz, an associate professor of economics at Jönköping International Business School, to explore how newspaper coverage of state unemployment rates affects the results of gubernatorial races. Their findings were recently published in a paper in the American Journal of Political Science.
To isolate the effects of media coverage, they focused on unemployment “milestone” events that generated more media attention. Milestones produced variation in news coverage of the economy across states with negligible differences in underlying economic conditions, allowing Martin and Garz to separate the effect of news about the economy from the effect of the actual state of the economy itself. The influence of these prominent news stories was significant: “The relationship between unemployment rates and voting is much stronger if there’s a milestone than it is if there’s no milestone,” Martin says.
A Bias Toward Round Numbers
Each month, the Bureau of Labor Statistics publishes a report of unemployment rates by state. Its figures are rounded to the nearest decimal place — an important detail that plays into journalists’ sense of what is newsworthy. Martin and Garz looked for instances between 2000 and 2018 when unemployment rates crossed a milestone, defined as crossing a round number, such as going from 4.9% to 5.1%. They found that when unemployment rates pass these thresholds, there is a discontinuous and substantial increase (around 10%) in the amount of newspaper coverage of unemployment.
For example, let’s say there are two states, A and B. In state A, the last reported unemployment rate was 4.6%. In state B, the figure sits at 4.5%. Let’s also say that in a given month, both states’ unemployment rate increases by 0.4%: State A hits the 5% mark, while state B remains just shy of the round number, at 4.9%. The study’s findings indicate that the state that reaches 5% will experience more coverage of unemployment conditions, simply because its rate passed a benchmark.
“The difference between a state that has a rate of 5% and one that has a rate of 4.9% — that’s not a real difference,” Martin says. “It’s a measurement error. So the actual state of the economy is quite similar in both those places. And so what we get from that is variation in the amount of media coverage of the economy in places with similar rates, not related to actual differences in the economy.”
So what accounts for the variation in coverage? As Martin sees it, even when the unemployment level and the amount of change are similar in two states, crossing a round number informs reporters’ assessment of the story’s newsworthiness. “It’s a psychological bias that people tend to look at the first digit of a number, and 10 seems bigger than 9.9. It’s the reason that prices have 9 at the end of them,” Martin explains. This “left-digit bias” leads reporters to frame stories pegged to round numbers as more important or historic. “So that kind of story, we think, is driven by the psychological bias toward the first digit,” he says.
Grading Governors on Jobs
Once they determined that unemployment milestones get more news coverage, Martin and Garz then looked at how this affects voting.
They focused on races for the governor’s seat because, as Martin explains, there’s a “long-standing literature that suggests that governors and executives in general, like presidents, are held accountable for the economy.” Governors can enact state-level policies and run agencies; in voters’ minds, they are seen as having direct responsibility for the state’s economic conditions. “The evidence that incumbents benefit from a strong economy and are punished for a bad economy is stronger for executives than it is for legislators.”
With the actual economic conditions on the ground held constant, Martin and Garz discovered milestone effects on incumbents’ share of the vote. Their data indicates that a “good” milestone event (such as a falling unemployment rate crossing a round number) immediately prior to an election helps boost a sitting governor’s vote share by about 5%. Conversely, a negative milestone event causes a more than 10% decrease in the incumbent’s vote share. That number came as a surprise to Martin: “The size of the effect on the governor’s race is bigger than we anticipated,” he says.
When there was no unemployment milestone, the effect of unemployment rates on elections was flat, further illustrating the impact of economic news as elections approach. “When there isn’t a lot of media coverage, [people] don’t know that and so they don’t use it in their voting decisions,” Martin says.
Martin says his research reveals the media’s agenda-setting power, “something that’s hard to detect a lot of the time.” He hopes his findings will help make journalists more aware of their biases and will further demonstrate that the media’s “ability to determine what people are thinking about, like what issues they consider when they vote, is really consequential for elections and for accountability.”
For media inquiries, visit the Newsroom.
Explore More

Nine Stories to Get You Through Tax Season

Public Pensions Are Mixing Risky Investments with Unrealistic Predictions